
- Adrian Zwoliński
- Read in 5 min.
In this article, I present a quick and maintainable way to set up and deploy Prometheus on Kubernetes. We will focus on deployment using Helm Charts and how to configure it easily.
I’m sure you already know what Prometheus is, but quick reminder below.
What is Prometheus?
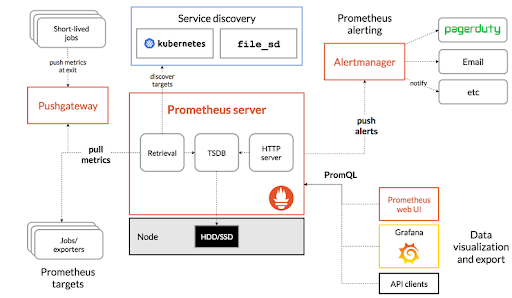
Prometheus is an open-source monitoring and alerting system. It has multiple tool components, including:
- the main Prometheus server, which scrapes and stores time series data.
- client libraries that instrument the application code.
- a push gateway for handling short-term tasks.
- special-purpose exporters are provided for services like HAProxy, StatsD, Graphite, etc.
- alertmanager to handle alerts.
- various support tools.
- Graphite or other API consumers can be used to visualize the collected data.
Many of them are optional.
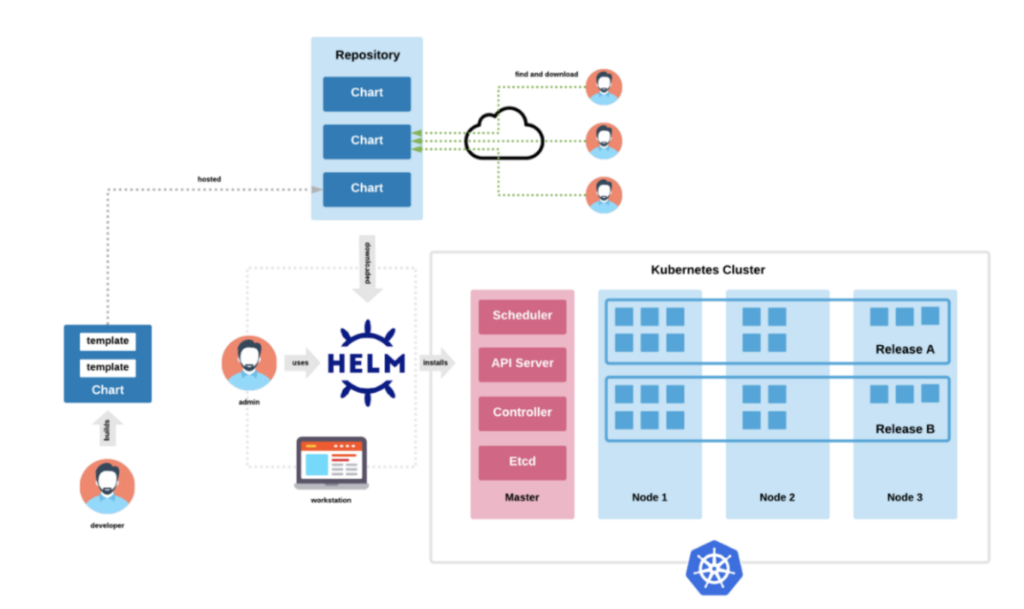
Helm Charts
Helm is package manager for Kubernetes and is a perfect tool to find, share and use software.
Helm Charts therefore help to define, install, and upgrade even the most complex Kubernetes application and allow controlling and maintain it easily by using a template where all Kubernetes deployment is defined.
Let’s start and set it up. Here we will be working on mickrok8s k8s cluster, but it applies anywhere.
Install Helm from script like in commands below or other way you want, but keep in mind we will be using Helm 3 here, For Helm 2 you will need Helm server (Tiller) as well.
$ curl -fsSL -o get_helm.sh https://raw.githubusercontent.com/helm/helm/main/scripts/get-helm-3
$ chmod 700 get_helm.sh
$ ./get_helm.sh
In this guide, instead of creating our own Prometheus template, we will use existing Helm Charts, which are available on GitHub and are well tested and maintained.
We need to add the Prometheus repository via Helm and update it like below.
helm repo add prometheus-community https://prometheus-community.github.io/helm-charts
helm repo update
A message with success status should appear after that.

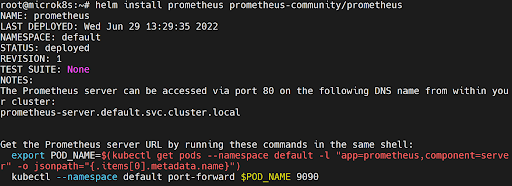
We can install Prometheus without creating our own template and only use default values:
helm install prometheus prometheus-community/prometheus
When we want to change the configuration, the best approach is to create a custom template yaml file. Copy all the default values and paste them there. Then overwrite what you want to change, and remove the unmodified values, which, if not specified, will be the default.
Here, you have values for default Prometheus chart. Once all values are configured, you can simply use the -f flag to point to your yaml file.
helm install -f prometheus.yaml prometheus prometheus-community/prometheus
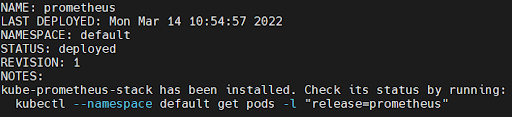
As a result, we should see the output as below.
We can check it with the Helm list command.

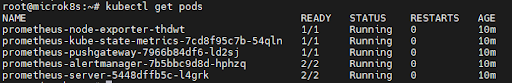
Or just check our created pods with kubectl get pods and consequently we should see all components working.
If you only want to use Prometheus, set enabled to false as in the yaml file below, and therefore all other options will be set to the default values.
alertmanager:
  enabled: false
kubeStateMetrics:
  enabled: false
nodeExporter:
  enabled: false
We can uninstall our Helm Chart, pointing out the name we provide for installation.

With one command, we can deploy and uninstall the whole stack just effortlessly.
Access to Prometheus UI
Default port for Prometheus dashboard is 9090. We can forward port to host by command and consequently access the dashboard in the browser on http://localhost:9090.
kubectl port-forward <prometheus-pod-name> 9090
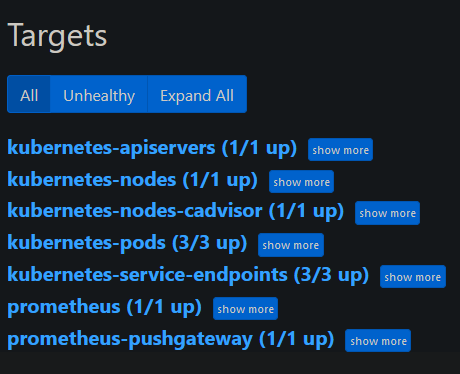
In the Status → Targets section, we can see all components by Prometheus and check if all are alright.
Here we can see everything is up and well-connected without any additional and manual configuration thanks to the Helm Charts.
Kube Prometheus Stack – powerful monitoring stack
Above we focused on how Helm Charts works and how to deploy the simplest monitoring, here we will try to do a quick overview of more advanced and complex set up.
Kube Prometheus Stack is a repository, which collects Kubernetes manifests, Grafana dashboards, and Prometheus rules combined with documentation and scripts. This provides easy to operate end-to-end Kubernetes cluster monitoring with Prometheus using the Prometheus Operator.
We install it similarly like earlier, but we provide a kube-prometheus-stack repository.
helm install prometheus prometheus-community/kube-prometheus-stack
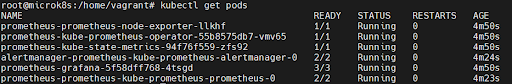
Afterwards we can list our pods and see if everything is running smoothly.
Access to Grafana UI
Default port for Grafana dashboard is 3000, we can forward port to host by command like below and thus gain access to the dashboard by browser on http://localhost:3000.
kubectl port-forward <grafana-pod-name> 3000
For Prometheus Operator default login is admin and password, prom-operator. You can change it by adding new below in yaml file and providing it in installation.
grafana:
  adminPassword: <password>
In Dashboards → Boards, we have 25+ available pre-built dashboards with various metrics already set up and connected with Prometheus. Same in Alerting sections, we should see an enormous number of prepared alerts.

Summary
What we have achieved is a fast and effortless setup of a complex monitoring and alarming stack.
It’s all thanks to well-prepared Helm Charts, where you get everything by hand, instead of manually creating and connecting different elements. Of course there is more to it and you can add your own services to existing charts.
This was more of a simple, quick demonstration of how these things work. You can find more information here.
Check out other articles in the technology bites category
Discover tips on how to make better use of technology in projects